Safety Symbols: Sharp Instrument Safety Name Answer Key
Date
__________________ Period _____
Teacher
________________ Seat # _____
Radioactive Decay Lab
Problem: Accept any
reasonable response
Hypothesis: Accept any
reasonable response
Materials:
Graph paper Two licorice sticks – different colors (e.g., red and chocolate)
Scissors Two colored pencils –
matching licorice colors
Metric
ruler Watch with second
hand
Procedure: Observation:
1. Use the scissors to cut one
licorice 1.
______________________________________
stick
to a length of 160 mm.
2. Use the watch as a timer to
count a 2.
______________________________________
four-second
interval, use the ruler to
determine
the midpoint of the licorice ______________________________________
stick,
and cut the stick in half at the end
of
four seconds. Remove one of the two
______________________________________
halves
by eating it to represent radioactive
decay. Record the length of the remaining
______________________________________
half
in the Data Table.
3. Repeat step number 2 as many
times as 3.
______________________________________
you
can until the remaining licorice stick is
too
small for you to measure accurately. ______________________________________
4. Plot the values in your data
table on 4.
______________________________________
graph
paper according to the teacher’s
directions. The time should be plotted on
______________________________________
the
x-axis and the lengths should be plotted
on
the y-axis. ______________________________________
5. Use the scissors to cut the
second 5.
______________________________________
licorice
stick to a length of 100 mm.
6. Using Table B below, cut the 6.
______________________________________
licorice
stick so that the total length
equals
the next value in the table below. ______________________________________
Remove
the “decayed” portion by eating
it. ______________________________________
7. Repeat step number 6 for
each column 7. ______________________________________
in
Table B below.
8. Plot the values in Table B
on the same 8.
______________________________________
graph
that you used for your data from the
first
licorice stick.. ______________________________________
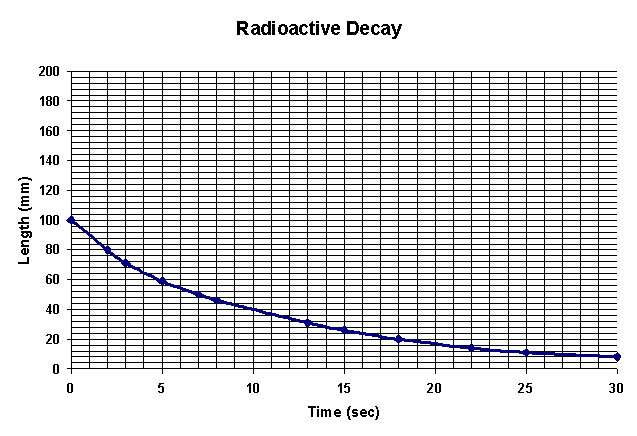
Table B:
|
Time (sec) |
0 |
2 |
3 |
5 |
8 |
13 |
15 |
18 |
22 |
25 |
30 |
|
Remaining Length (mm) |
100 |
80 |
71 |
59 |
46 |
31 |
26 |
20 |
14 |
11 |
8 |
Data Table:
|
Time (sec) |
0 |
4 |
8 |
12 |
16 |
20 |
24 |
28 |
|
Remaining Length (mm) |
160 |
80 |
40 |
20 |
10 |
5 |
2.5 |
1.25 |
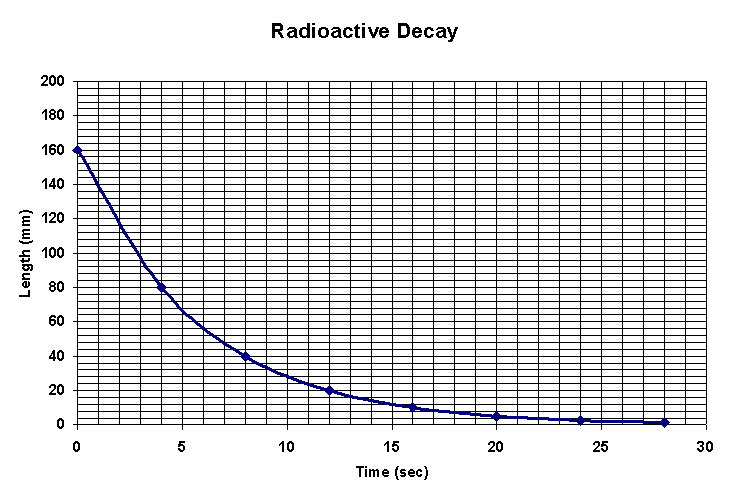
Data Graph:
Questions:
1. What is the half-life of the
first licorice stick? 4 seconds
2. What is the half-life of the
second licorice stick? 7 seconds

Conclusion: Accept any
reasonable response. Students should
recognize the meaning of
half-life and be able to interpret it for both of the licorice stick
examples. Students may also
observe that even though half of the licorice “decays” during the
initial half-life, it takes many
half-lives for the remaining amount to “decay”.