Note:
if this tutorial is helpful in the creation of your own webpages,
please explicitly acknowledge this in your work (e.g. URL, Author,
and, ideally, a link to this page). And please
drop an email to marcey@callutheran.edu
with a link to your page/s. This helps with funding opportunities
for the OMM and helps ensure continued development of this resource.
Thanks!
Directions
Please leave comments/suggestions or please acknowledge use of this site by visiting our feedback page
Note: surfaces require a lot of memory and are slow to load. This is especially true now that we are using JSmol and HTML5 instead of the java-based Jmol. If you get an unresponsive script, please choose continue. you may need to do this several times, depending on the script.
This exhibit displays molecules in the left part of the screen,
and text that addresses structure-function relationships of
the molecules in the right part (below). Use the scrollbar to
the right to scroll through the text. If you are using browser other than Firefox (the recommended browser for this site), be sure to allow popups. In Chrome, you can click on the popup blocker icon in the right part of the address bar..
To evoke renderings of the molecule that illustrate particular
points, click the radio buttons:
Jmol, a Java applet
used to view molecules in web pages, can read scripts that are contained
in Jmol buttons. These scripts are used to change the rendering of
the molecule to illustrate important structural features.
This exhibit provides
example Jmol scripts that can be copied and pasted into the javascript
tags for buttons. Each section starts with a discussion of the uses
of various renderings and ends with a table that includes a list of
buttons (left column -
) containing sample scripts (right column). These evoke particular
renderings of the molecules displayed in the left frame. If you are
new to Jmol scripting, it is suggested that you spend time going through
the exhibit in its entirety, reading the scripts to see how they can
be employed in your own web pages.
Jmol
uses two different units of measurement that can be used with display
commands. One is the standard, atomic-resolution unit, the Angstrom
(Å); 1 Å = 10-10 meters. Chime also uses a
novel unit, the RasMol unit; 1 RasMol unit = 1/250 Å. The display
codes (see below) can be modified to specify dimensions in either
RasMol units or Angstroms by adding a numerical value after the name
of a command.
Angstroms are indicated by a decimal in the numerical value and RasMol
units are used as a default when no decimals are employed. For example,
a 'wireframe 125' script specifies a wireframe display in 125 RasMol
Units. This is equivalent to the script "wireframe 0.5"
(0.5 Å).
The
default display for most pdbs is wireframe, as shown at left. Wireframe
is very useful because it clearly shows the covalent bonds (except
S-S bonds) between all atoms of a molecule.
Varying
the thickness of wireframe displays can provide useful alternatives
in illustrating points.
Spacefill
is another commonly used display. Spacefill rendering displays the
Van der Waals radius of each atom as a solid sphere by default.
Spacefill
radii can be altered by a numerical specification (see below).
Different "ball and stick" representations can be achieved
by varying the thickness of wireframe and the radii of spacefill.
Dots
is a display similar to spacefill in that the diameter of the spheres
formed are equal to that of the Van der Waals radius. Dots combines
easily with other display commands to provide useful effects. Combining
wireframe and dots displays can show Van der Waals surfaces clearly
for a loop or secondary structure.
So
far, we have considered displays that affect all atoms of a molecule,
unless particular atoms are selected (see below, The
Select Command). Sometimes showing only the backbone of a molecule
is desired. There are several displays that illustrate the backbone
conformation of a molecule:
The
backbone display shows the polypeptide backbone of a protein
or the sugar-phosphate backbone of a nucleic
acid as a train of bonds connecting the adjacent alpha carbons
of each amino acid (protein) or phosphorus atoms (nucleic acid)
in sequential order.
Trace
is a display similar to backbone, but with smoothed transitions
between the alpha carbons of a peptide chain
or the phosphorus atoms of nucleic acids.
There
are two displays that are excellent for showing secondary structure:
ribbons;
cartoons.
Ribbons smooth the backbone, like trace, but display the backbone
as a wide, flattened band. Cartoons does the same except that nucleic
acid backbones are displayed as a trace and the
nitrogenous bases of nucleic acids
are rendered as flat rings. Numerical modifications can be
used to change the width of the band. In default mode of both ribbons
and cartoons, the width of alpha helical
and beta strand secondary structure
is greater than that of loops. Cartoon has the feature of indicating
amino-carboxy polarity
of peptides. This is quite convenient, e.g. when showing the parallel
or antiparallel arrangement of beta
strands
in a beta sheet.
Strands
is a rendering similar to ribbons and cartoons, but with the backbones
displayed as a series of thin lines. Strands can be indicated with
dashed lines (see below).
Rockets and
meshribbons are two additional representations of backbone conformations.
Lighting effects can be employed to change the appearance of a molecular
display. For example:
Ambient
lighting intensity can be manipulated.
Specular
highlights on atoms are white reflections of the "light source".
The degree of specular highlighting can be changed.
It is sometimes useful to display the surfaces of molecules. For example,
the shapes of ligand binding pockets or catalytic sites are often
illuminated is a surface view. To learn about Jmol suface displays,
consult our SURFACES page.
Loading a pdb by use of a button is useful for introducing a new molecule
into an exhibit or for simply resetting a molecule after it has been
manipulated.
N.B.:
When constructing a Jmol script for a button in a molecular exhibit,
it is helpful to incorporate a series of default commands that turn
off any previous scripts invoked by other buttons. We recommend the
following set of commands be used upon loading: "set frank off;
select all; hbonds off; spin off; wireframe off; spacefill off; trace
off; set ambient 40; set specpower 40; slab off; ribbons off; cartoons
off; label off; monitor off". This "blank state" can
then be modified by subsequent commands in the script.
Once a pdb is loaded it is often useful to orient the molecule in
3-D by rotating it around the X,Y, or Z axes. Rotation commands are
expressed in degrees so a rotation of 360 around a particular axis
will show no change in the orientation of the molecule.
A molecule can
also be translated along any of the axes without rotation:
Translation along the X axis causes the molecule to move left or right.
Translation along the Y axis causes the molecule to move up or down.
Note: contrary to intuition, positive numbers for Y translation move
molecules down and negative numbers move molecules up. Translation
on the Z axis is called zoom, because it brings the molecule closer
to or farther away from the viewer. Translation commands are expressed
in percentage. Thus, to double the magnification (zoom), a numerical
value of 200 is used.
Rotation, translation,
and zoom commands to effect a desired view can be incorporated in
the initial loading of a pdb.
There are other,
smoother ways to move, rotate, and zoom molecules that will be discussed
later, in the Animation section.
relevant
Jmol scripts in buttons (the scripts below are often supplemented
by commands that orient molecules and change default displays
- see NB, above)
Place
between ' ' in button code
load
a new molecule (.pdb file)
load 'path to the pdb file', e.g.
load ../pdbs/a-helix.pdb
For the display
commands already discussed, and for coloring and bond options to be
addressed later, it is often desirable to limit rendering changes
to particular atoms or sets of atoms. The select command is used to
specify what atoms of a molecular file will be affected by subsequent
rendering commands (e.g spacefill, cartoons, etc.).
There are a number
of predefined sets of atoms such as "all", "backbone",
"protein", "ligand", "hetero", "helix",
"sheet", "sidechain", etc..
"Select all"
selects all atoms.
"Select protein"
or "select amino" both select all of the amino acids.
"Select nucleic"
selects all nucleic acid atoms, but "select dna" or "select
rna" works on specified nucleic acid residues (DNA=a,t,g,c; RNA=a,u,g,c).
"Select hetero"
will select all heterogeneous atoms, including water, ions, and ligands.
"Select water"
or "select hoh" will select only the water molecules (usually
only oxygen atoms of water are present in a pdb file), and "select
ligand" will select only a ligand.
"Select helix"
and "select sheet" are used to select alpha helices and
beta sheets, respectively.
"Select backbone"
and "select sidechain" are used to select backbone or sidechain
atoms, respectively.
The select command
can also be used to select a specific chain in a molecular file, a
single amino acid, or even a single atom (useful!). In
selecting atoms or residues, it is possible to discriminate between
chains in a file that contains multiple molecules. For example, let's
say that you wish to select a single residue (#10) on one chain of
a pdb file with a dimeric protein bound to DNA (four chains). Each
chain will likely have a residue # 10. If the command "select
10" were used, four residues would be selected, one on each of
the protein chains and one on each strand of DNA. Instead, if the
desired residue (#10) is on chain A, then the script "select
:a and 10" or "select 10:a" would select only residue
#10 on chain A, ignoring the residue #10s on other chains.
Define is a command
that is very useful when dealing with a group of atoms that do not
belong to a predefined set, such as a phosphate on a ligand or the
tail of an ATP molecule. The atoms of interest can be associated under
one atom expression that can then be selected with ease. The format
of the script for defining a group of atoms is "define 'name
of group' 'atoms to be grouped' ".
Another type of
selection is the restrict command. "Restrict" limits the
display to those atoms specified in the restrict script.
Selected atoms
can be labeled using the label command. Labels can be colored, and
the fontsize height set (in pixels) using appropriate commands. The
default label color is the selected atom's color and the default fontsize
is 8 pixels. The
position of the label can be altered by setting the label offset.
relevant
Jmol scripts in buttons (the scripts below are often supplemented
by commands that orient molecules and change default displays
- see NB, above)
Place between ' ' in button code
display all atoms in spacefill
select all; spacefill; select nucleic; color red;
select protein; color magenta;
display protein in spacefill, display RNA in wireframe
display ligand atoms in spacefill, all others in wireframe, label
atom number 3923 "glycerol," offset label [x, 20; y,
0]
select all; wireframe; select ligand; spacefill;
select atomno=3923; label glycerol; color label black; set labeloffset
20 0;
display ligand atoms in spacefill, all others in wireframe, label
atom number 3923"glycerol," offset label [x, 20; y,
0], set fontsize of label to 20, set color lof label to red
select all; wireframe; select ligand; spacefill;
select atomno=3923; label glycerol; color label black; set labeloffset
20 0; set fontsize 20; color label red;
Coloring atoms,
sets of atoms, or other selections is quite useful in crafting quality
molecular exhibits. Explanatory text can be co-colored with specified
structural features. Jmol is quite versatile in recognizing the names
of prespecified colors, HTML binhex color codes, and RGB triplet codes.
Jmol recognizes
the RasMol defined color set and an extensive list of Javascript colors.
Recognized colors include: blue,
deepskyblue,
cornflowerblue,
cadetblue,
turquoise,
cyan, yellow,
gold, green,
greenblue, chartreuse,
mediumspringgreen,
aquamarine,
deeppink,
magenta, purple,
darkmagenta,
blueviolet, violet,
orange, red,
redorange, indianred,
lightsalmon, tan,
burlywood, sienna,
gray, white, and black.
HTML binhex and
RGB triplet codes are similar in that the colors are made up of alphanumerical
values for red green
and blue. For binhex, the highest value
is FF and the lowest is 00 (zeros, not O's). For RGB, the highest
value is 255 and the lowest is 0. The format for binhex in Jmol is
[x(Red)(Green)(Blue)], e.g. "color [xFF0088]".
The format for RGB triplet codes in Jmol is [(Red),(Green),(Blue)],
e.g. "color [255,0,255]".
Default coloration
is CPK (Corey, Pauling, Kultun), based on atom identity. Carbon is
colored light gray, oxygen red,
hydrogen white, nitrogen light blue,
sulfur yellow, phosphorous orange,
chlorine green, zinc brown,
sodium blue, iron purple,
calcium or metals dark gray, and unknown
deep pink. In addition to CPK, Jmol has
access to some additional predefined color schemes (not all schemes
are discussed here):
"Amino" is a scheme that assigns colors to amino acids
based on their chemical properties, e.g. acidic, basic, hydrophobic,
or polar. The colors are ASP,
GLU, CYS,
MET, LYS,
ARG, SER,
THR, PHE,
TYR, ASN, GLN, GLY,
LEU,
VAL, ILE,
ALA,
TRP, HIS
and PRO.
Nucleic
acids
are colored tan in the "amino" scheme.
"Chain"
is a scheme that colors each different chain in a multiple molecule
pdb file a different color.
"Group"
is a scheme that colors protein chains differentially in the amino-carboxy
direction.
"Group"
colors nucleic acid chains differentially in the 5'>3'
direction.
"Temperature"
is a scheme that colors atoms according to their anisotropic temperatures,
as stored as a beta value in a pdb file. Anisotropic temperature is
indicative of of an atom's mobility or uncertainty of position. The
more mobile, "warmer" segments are colored red,
progressing to more immobile blue fragments.
"Structure"
is a very useful color scheme in that it differentially colors a protein's
secondary structure (a-helices
and b-sheets).
It is best to use a display command that illustrates secondary structure
when using the structure color scheme (e.g. ribbons, cartoon, backbone,
trace, or strands - see Display section).
It is quite effective
to use consistent color schemes to show some molecular features.
DRuMS
is a set of seven color schemes that provides a uniform standard for
coloration in molecular exhibits. The colors used in the basic DRuMS
scheme are: protein,
DNA, RNA,
a-helix
and b-sheet.
For amino acids the DRuMS colors are: hydrophobic
amino acids, polar acidic amino acids,
polar basic amino acids, and
polar uncharged amino acids.
See the DRuMS website for further information:
It
is sometimes necessary to go beyond the DRuMS schemes to illustrate
important structural features. For example, it may be useful to distinguish
between several pairs of chemically similar amino acids engaged in
ionic bonding. In this case, custom colors must be used to indicate
molecular identity. Fortunately, it is easy to instruct Jmol to read
any user-specified
color code.
More
information on color options is available on the Jmol
colors page.
relevant
Jmol scripts in buttons (the scripts below are often supplemented
by commands that orient molecules and change default displays
- see NB, above)
Place between ' ' in button code
display protein in deepskyblue cartoons, nucleic acid in CPK default
coloration and spacefill
select protein; cartoons; color deepskyblue; select nucleic;
spacefill; color cpk;
display protein in magenta cartoons, nucleic acid in yellow spacefill
using HTML binhex
select protein; cartoons; color [xFF00FF]; select nucleic; spacefill;
color [xFFFF00];
display protein in blue cartoons, nucleic acid in yellow spacefill
using RGB
select protein; cartoons; color [0,0,255]; select nucleic; spacefill;
color [255,255,0];
display DNA and protein in "amino" scheme
select all; color amino;
display protein in cartoons, DNA in spacefill, color chains differentially
select protein; cartoons; select nucleic; spacefill; select
all; color chain;
display one protein chain in trace, color in "group"
scheme
restrict :a; trace 100; select all; color group;
display one protein chain in spacefill, color in "temperature"
scheme
restrict :a; spacefill; color temperature
display protein in cartoons, color in "structure" scheme
Jmol recognizes
by default the standard covalent bonds linking atoms in a molecule.
Disulfide (S-S) bonds can also be displayed in Jmol by the use of
the "ssbonds" command. The color of the bond is that of
the two linked atoms, but it can be changed with the "color ssbonds"
command. Similarly, "hbonds" and "color hbonds"
tells Chime to show and color hydrogen bonds that are identified by
Jmol.
You
may wish to illustrate a connection or bond that is not specified
in a pdb file or read by Jmol. This can be accomplished in several ways, depending on your preferences. Two of these are MEASURE and CONNECT.
> The MEASURE command allows you to connect two atoms of choice with the distance between them displayed by default. You can specify the distance units as Angstroms if you wish, instead of the default nm (see below). To turn off the distance label, use the SET MEASUREMENT OFF command. MEASURE OFF and MEASURE ON can be used to toggle the measurment line off and on.
> The CONNECT command also allows you to connect two atoms of choice via bond creation and permits a wide choice of display options for the new bond. See below for CONNECT techniques.
To build an arrow in your molecular display, you can use the DRAW command. To start, use the Jmol.jar application and pick an imaginary line between two atoms such that the line lies mostly outside the molecule. Use the following script to construct an arrow:
Naturally you use any color you wish and can scale the arrow and change its width as you see fit. Then, after using the $ "set picking draw" command, you can use the "SHIFT" key and mouse to drag the arrow to any position in your display. Use the "ALT" key ("OPTION" in Macs) and mouse to change the vertices of the arrow to position it as you see fit. When you have finished, be sure to reset the picking status by using $ "set picking on." Then use the $ "show draw" command to obtain a complete set of commands that you can use in your webpage button to draw the arrow in the position you want.
relevant
Jmol scripts in buttons (the scripts below are often supplemented
by commands that orient molecules and change default displays
- see NB, above)
Place
between ' ' in button code
display protein backbone in trace, cys residues in wireframe
Animations
are sometimes superior to the rotations and translations discussed
previously because animations can cause the molecule at hand to move
or change position in a smooth fashion. Coupled with creative displays
and coloration, animation commands can be employed to great effect
in illustrating key points of molecular structure.
One
of the most useful animation commands is "move." "Move"
is followed by a set of numbers that quantify a set of animation parameters.
Here we describe the use of the first nine such parameters, i.e.:
"move _ _ _ _ _ _ _ _ _ ", where each of the nine spaces
contains a number that specifies the degree of an animation parameter.
The parameters
for each space following a "move" command (in order) are:
1
2
3
4
5
6
7
8
9
Xrot
YRot
ZRot
Zoom
XTrans
YTrans
ZTrans
Slab
TotalTime
The first three
parameters are rotations around the X, Y and Z axes. Fourth is the
zoom modifier, expressed in positive (zoom in) or negative (zoom out)
numbers. Note that in a "move" command, zoom values are
not expressed in percentages of the original, unlike the use of "zoom"
as a stand alone script command. The next three parameters (5,6 and
7) deal with translation along the three axes (7, Z translation, is
not functional - always use zero in that slot). Note: contrary to
intuition, positive numbers for Y translation move molecules down
and negative numbers move molecules up. 8th is the slab parameter.
Slab "slices" the molecule, i.e. removes atoms down to a
specified depth so that interior features may be easily observed.
Parameter 9 is the amount of time (in seconds) to take in performing
the previous move commands. It is important to allow sufficient time
for the animation so as not to disorient the viewer. Contrariwise,
too long an animation can prove tedious. There are two other move
parameters, Frames/Second and MaximumAcceleration that can be specified
in the 10th and 11th positions (not considered here).
So, "move
0 360 0 200 0 15 0 0 6" would, in 6 seconds, rotate a molecule
360 degrees around the Y axis, while simultaneously zooming (200)
and moving the molecule down (Y axis translation: +15). "Move"
is used in some of Jmol's most impressive animations and provides
great versatility, especially when coupled with "delay."
"Delay"
pauses the Jmol script for a specified amount of time before the next
command is executed. "Delay" is specified in seconds, e.g.
"delay 5" causes a pause of five seconds. In addition to
use in animations, "delay" can be an effective tool in a
variety of display and coloration contexts.
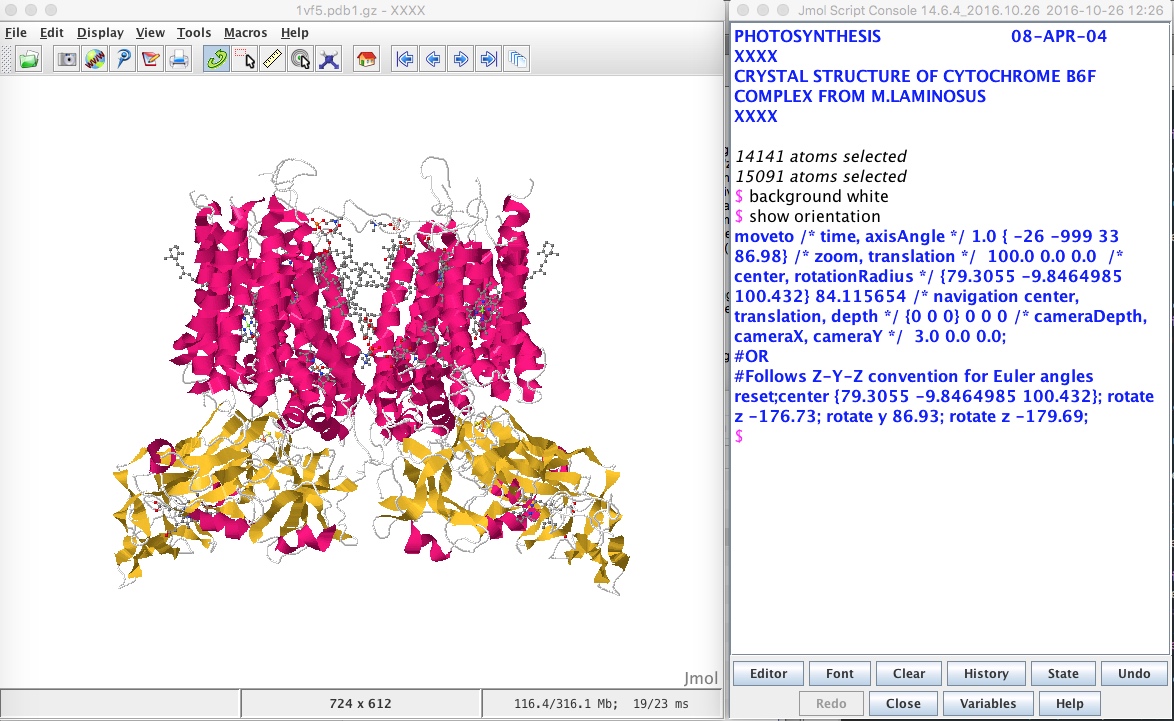
Perhaps the most essential animation command is "moveto". The "moveto"
command can be used to rotate a molecule around each axis and to zoom. This command is useful
when using the Jmol application to determine the best viewing orientation
of a molecule. After adjusting the orientation of a molecule, Use the "show orientation" command in the apllication scripting (console) window to display the appropriate "moveto" command to elicit a particular orientation of choice. Then use this "moveto" command in your button scripts as needed. In the following example, a molecule has been positioned in the Jmol application, and the show orientation command has been used to generate "moveto" parameters. You can copy and paste the resulting moveto command (e.g. moveto /* time, axisAngle */ 1.0 { -26 -999 33 86.98} /* zoom, translation */ 100.0 0.0 0.0 /* center, rotationRadius */ {79.3055 -9.8464985 100.432} 84.115654 /* navigation center, translation, depth */ {0 0 0} 0 0 0 /* cameraDepth, cameraX, cameraY */ 3.0 0.0 0.0;) into a button script to orient the molecule to your moveto specifications. Note: the first number is the time, in seconds, to execute the move, so if you are using a moveto to orient a molecule to a correct position prior to displaying it in a webpage/button, you can change the "1.0" to, say, "0.2". If your moveto is being used to take the reader from one orientation to another in order to illustrate a structural feature, you will probably change the time to >4 seconds.
To create a new *.pdb file that contains two molecules superimposed in order to easily illustrate relevant conformational changes, use the SUPERPOSE program, kindly provided at: http://wishart.biology.ualberta.ca/SuperPose/. By uploading two molecules that differ slightly in conformation, SUPERPOSE will generate a "result".pdb containing two models that you can manipulate to illustrate conformational shifts (see example below).
Changes
in display (e.g. wireframe thickness, spacefill radii), separated
by brief delays, can be used to "build up" or "dissolve"
molecules to provide smooth transitions in rendering.
Blinking can be
used to draw attention to particular molecular features (e.g. bonding
partners). Blinking is achieved by causing the feature to flash on
and off or to expand and contract a few times, using appropriate display
commands separated by delays.
The "loop"
command can be used to repeat a particular animation script (or any
other script) until another command is invoked. "loop 3"
indicates the previous script commands will be repeated after a 3
second delay.
relevant
Jmol scripts in buttons (the scripts below are often supplemented
by commands that orient molecules and change default displays
- see NB, above)
Place between ' ' in button code
display molecule in tuquoise cartoons, rotate 90º around
X axis in 3 seconds, pause for 1 second, rotate back in 3 seconds
display protein in indianred cartoons, chromophore in mediumspringgreen
spacefill, cut away 40% of molecule to show chromophore, rotate
90º on X axis in 4 seconds, restore all atoms
display protein in indianred cartoons, chromophore in mediumspringgreen
spacefill, cut away 40% of molecule to show the chromophore in
the interior, spin molecule on y axis (20º/second)
select all; color indianred; cartoons; select cro; color
mediumspringgreen; spacefill; delay 2; slab on; slab 60; delay
1; set spin y 20; spin
a long script that uses "BOILERPLATE" settings to acheive a blank slate with appropriate settings to begin visualization of a molecule, and a pdb created with the SUPERPOSE program in order to illustrate conformational changes. Note the switching between models that were generated in the SUPERPOSE output.
load 2dn2_2dn1.pdb; model all; ##### BOILERPLATE start #####; select all; wireframe off; spacefill off; ribbons off; strands off; cartoons off; spin off; trace off; dots off; draw off; set frank off; set echo bottom center; echo PDB ID: 2DN2 (deoxy) >> 2DN1 (oxy); color echo black; set ambient 40; set specpower 40; slab off; label off; monitor off; measurements off; set measurementunits angstroms; set defaultdistancelabel "%0.1VALUE \u00c5"; set labelfront on; set ribbonborder on; set antialiasdisplay on; isosurface delete; ##### BOILERPLATE end #####; moveto /* time, axisAngle */ 0.1 { -777 593 212 125.95} /* zoom, translation */ 265.98 -20.49 17.02 /* center, rotationRadius */ {28.1835 28.1835 0.0} 36.82993 /* navigation center, translation, depth */ {0.0 0.0 0.0} 61.55707 -97.41382 0.0; ##### DEFINITIONS START#####; define ~alpha :a; define ~beta :b; ##### DEFINITIONS END#####; delay 2; select model=1 and protein; trace 10; color turquoise; select his87; color amino; select hem and model=1; color cpk; wireframe 75; spacefill 150; select iron and model=1; spacefill 250; set echo bottom center; echo DEOXY; font echo 50; font echo 50;color echo blue; select his87; color amino; select his87 and model=1; wireframe 100; select atomno=648 and model=1; label his87; color label black; delay 2; select atomno=648 and model=1; label his87; color label black; delay 2; select model=1; trace off; spacefill off; wireframe off; select model=1.2 and protein; trace 10; color turquoise; select his87; color amino; select hem and model=1.2; color cpk; wireframe 75; spacefill 150; select iron and model=1.2; spacefill 250; set echo bottom center; echo OXY; font echo 50; color echo red; select his87 and model=1.2; wireframe 100; color amino; select oxy; spacefill 175; color red; delay 2; select model=1.2; trace off; spacefill off; wireframe off; select model=1 and protein; trace 10; color turquoise; select his87; color amino; select hem and model=1; color cpk; wireframe 75; spacefill 150; select iron and model=1; spacefill 250; set echo bottom center; echo DEOXY; font echo 50; font echo 50;color echo blue; select his87; color amino; select his87 and model=1; wireframe 100; select atomno=648 and model=1; label his87; color label black; delay 2; select model=1; trace off; spacefill off; wireframe off; select model=1.2 and protein; trace 10; color turquoise; select his87; color amino; select hem and model=1.2; color cpk; wireframe 75; spacefill 150; select iron and model=1.2; spacefill 250; set echo bottom center; echo OXY; font echo 50; color echo red; select his87 and model=1.2; wireframe 100; select oxy; spacefill 175; color red; delay 2; select model=1.2; trace off; spacefill off; wireframe off; select oxy; spacefill off; select model=1 and protein; trace 10; color turquoise; select his87; color amino; select hem and model=1; color cpk; wireframe 75; spacefill 150; select iron and model=1; spacefill 250; set echo bottom center; echo DEOXY; font echo 50; color echo blue; select his87 and model=1; wireframe 100; delay 2; select model=1; trace off; spacefill off; wireframe off; select model=1.2 and protein; trace 10; color turquoise; select his87; color amino; select hem and model=1.2; color cpk; wireframe 75; spacefill 150; select iron and model=1.2; spacefill 250; set echo bottom center; echo OXY; font echo 50; color echo red; select his87 and model=1.2; wireframe 100; select oxy; spacefill 175; color red; delay 2; select model=1.2; trace off; spacefill off; wireframe off; select oxy; spacefill off; select model=1 and protein; trace 10; color turquoise; select his87; color amino; select hem and model=1; color cpk; wireframe 75; spacefill 150; select iron and model=1; spacefill 250; set echo bottom center; echo DEOXY; font echo 50; color echo blue; select his87 and model=1; wireframe 100; delay 2; select model=1; trace off; spacefill off; wireframe off; select model=1.2 and protein; trace 10; color turquoise; select his87; color amino; select hem and model=1.2; color cpk; wireframe 75; spacefill 150; select iron and model=1.2; spacefill 250; set echo bottom center; echo OXY; font echo 50; color echo red; select his87 and model=1.2; wireframe 100; select oxy; spacefill 175; color red; delay 2; select model=1.2; trace off; spacefill off; wireframe off; select oxy; spacefill off; select model=1 and protein; trace 10; color turquoise; select his87; color amino; select hem and model=1; color cpk; wireframe 75; spacefill 150; select iron and model=1; spacefill 250; set echo bottom center; echo DEOXY; font echo 50; color echo blue; select his87 and model=1; wireframe 100; delay 2; select model=1; trace off; spacefill off; wireframe off; select model=1.2 and protein; trace 10; color turquoise; select his87; color amino; select hem and model=1.2; color cpk; wireframe 75; spacefill 150; select iron and model=1.2; spacefill 250; set echo bottom center; echo OXY; font echo 50; color echo red; select his87 and model=1.2; wireframe 100; select oxy; spacefill 175; color red; delay 2; select model=1.2; trace off; spacefill off; wireframe off; select oxy; spacefill off; select model=1 and protein; trace 10; color turquoise; select his87; color amino; select hem and model=1; color cpk; wireframe 75; spacefill 150; select iron and model=1; spacefill 250; set echo bottom center; echo DEOXY; font echo 50; color echo blue; select his87 and model=1; wireframe 100; delay 2; select model=1; trace off; spacefill off; wireframe off; select model=1.2 and protein; trace 10; color turquoise; select his87; color amino; select hem and model=1.2; color cpk; wireframe 75; spacefill 150; select iron and model=1.2; spacefill 250; set echo bottom center; echo OXY; font echo 50; color echo red; select his87 and model=1.2; wireframe 100; select oxy; spacefill 175; color red; delay 2; select model=1.2; trace off; spacefill off; wireframe off; select oxy; spacefill off; select model=1 and protein; trace 10; color turquoise; select his87; color amino; select hem and model=1; color cpk; wireframe 75; spacefill 150; select iron and model=1; spacefill 250; set echo bottom center; echo DEOXY; font echo 50; color echo blue; select his87 and model=1; wireframe 100; delay 2; select model=1; trace off; spacefill off; wireframe off; select model=1.2 and protein; trace 10; color turquoise; select his87; color amino; select hem and model=1.2; color cpk; wireframe 75; spacefill 150; select iron and model=1.2; spacefill 250; set echo bottom center; echo OXY; font echo 50; color echo red; select his87 and model=1.2; wireframe 100; select oxy; spacefill 175; color red;
a display using selection, define, several types of animation,
dissolving and building, culminating in blinking hydrogen bonds
between a base pair in double helical DNA - any part of the script
to the right is easily copied and pasted into a custom script
of the user's choice
It is sometimes useful to model molecular interactions by combining molecules from two or more separate pdb files. For example, perhaps you wish to visualize an interaction between a DNA binding protein and DNA, but the pdb file you have to work with only contains the protein. You therefore wish to add DNA to your PDB and model the protein-DNA interaction. Important(!): if you create a new pdb file by incorporating atoms from two separarate pdbs, you must state this clearly when you present your new pdb. It is essential that your reader know that you have MODELED an interaction and that your composite pdb file does not actually represent a structural determination of interacting molecules! To create a composite pdb file, you first determine which elements of existing pdbs you wish to extract and combine. This section is under construction.
Note:
if this tutorial is helpful in the creation of your own webpages, please
explicitly acknowledge your use of this page (URL, Author, and a link to this page) in your webpage/s. And please drop an email
to marcey@callutheran.edu.edu with a link
to your page/s. This helps with funding opportunities for the OMM and
helps ensure continued development of this resource. Thanks!